

Building a Driver-Based Model You Can Actually Update Monthly
- Most financial models rot because they are built as static artifacts, wired with hardcoded numbers that only their author understands, and disconnected from how the business actually generates results.
- A driver-based model links every financial output to the operational levers behind it, such as volume, price, headcount, and utilization, so an update is a matter of changing a handful of assumptions rather than rebuilding formulas.
- Keep it deliberately small. Only 2% of organizations run truly dynamic driver-based models, and the winners are not the most complex, they are the ones tied to the few drivers that explain most of the variance.
- The test of a good model is not elegance, it is whether you can update it in an afternoon each month with fresh actuals and get a number you would act on. That monthly refresh is the heartbeat of the Operating Cadence stage in the Greenwood Engagement Model.
There is a specific kind of financial model that dies quietly. It gets built in a burst of energy, usually for a board meeting or a fundraise, it is beautiful and detailed and forty tabs deep, and it is never opened again. Six weeks later reality has drifted from it, nobody trusts the outputs, and the founder is back to steering by bank balance. I have inherited a lot of these models. They are not bad math. They are bad architecture, built to be admired once rather than used every month.
The frustrating part is how common the failure is even among sophisticated teams. EY's 2026 FP&A research found that 46% of finance-team effort goes to collecting and validating data while only 31% goes to insight and action. A model that is hard to update makes that ratio worse, because every refresh becomes an archaeology project. This deep dive is about building the opposite: a driver-based model you can actually keep alive, because it reflects how your business really runs and because updating it is fast enough that you will bother.

Why Static Models Rot
Static models rot because the business changes faster than a hardcoded spreadsheet can absorb. When you type a revenue number directly into a cell instead of deriving it from units and price, you have frozen a moment in time. The instant volume shifts or you raise prices, the number is wrong, and because it is hardcoded there is no clean way to update it short of re-entering everything by hand.
The deeper problem is comprehension. Models break because assumptions are buried, formulas are nested five functions deep, and only one person knows how the thing works, an observation Jirav makes bluntly and that I see confirmed in nearly every model I inherit. When that person is busy, on vacation, or gone, the model becomes unmaintainable. It is not a planning tool anymore, it is a fragile relic that everyone is a little afraid to touch.
Then there is drift. As FP&A practitioners note, evolving business models, acquisitions, new product lines, and system changes all require the model to change with them, and historic trend-based budgeting cannot keep up because it projects the past forward instead of modeling what is happening now. Meanwhile the tooling has not moved on: Vena's 2026 research reports 90% of teams still run at least some of their modeling in Excel, and 52% of finance leaders say their revenue forecasts miss actuals by more than 6%. The spreadsheet is not the enemy. The static architecture inside it is.

Choosing the Right Drivers
The right drivers are the small set of operational levers that actually move your financial results, and choosing them well is the entire game. A driver is an input you can observe and influence, such as number of sales reps, deals per rep, average deal size, monthly churn, billable utilization, or units shipped. The model's job is to take those inputs and let revenue, cost, and cash fall out of the logic rather than being typed in.
Restraint is the hard part. The temptation is to model every variable in the business, which produces a machine so complex that no one can update or trust it. The contrarian discipline comes from finance leaders like Anders Liu-Lindberg, who argues you should start with business logic, cut any driver that does not explain most of the variance, and tie every remaining driver to a decision. If moving a lever would not change what you do, it does not belong in the model. This is why so few teams get it right. Per the 2025 FP&A Trends Survey, only 2% of organizations run genuinely dynamic driver-based models.
Different businesses run on different levers. A SaaS company lives on new logos, expansion, and churn, the logic I walk through in SaaS unit economics. A services firm runs on headcount, utilization, and bill rate, covered in professional services billing and margin. Pick the five to nine drivers that carry your P&L and ignore the rest. For a founder-level primer on the approach, my piece on driver-based forecasting for founders is the on-ramp to this deeper build.
Structuring for Monthly Updates
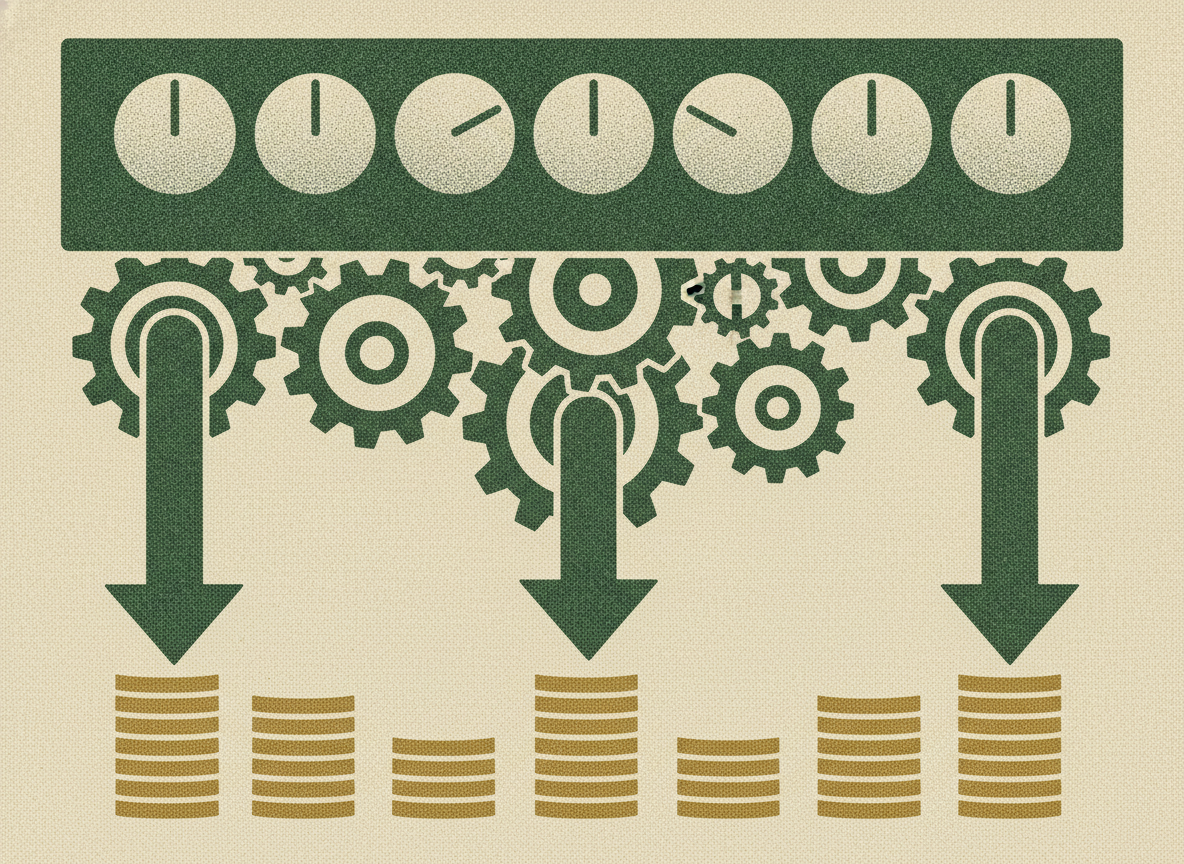
Structure the model so a monthly update touches assumptions, not formulas. That means one clearly labeled place for every driver, calculation logic that reads from those inputs and never contains a typed-in constant, and outputs that flow automatically once the assumptions change. If updating next month requires editing formulas, the architecture has already failed.
Three structural rules make a model maintainable. First, separate the layers: a drivers-and-assumptions tab, a calculation engine, and a reporting layer, with data flowing in one direction. Second, never hardcode inside a formula, because a constant buried in a calculation is a landmine for the next person who updates it. Third, write the model so someone other than the author can follow it, with labels, notes on each assumption, and an obvious path from input to output. These are the same maintainability principles the Corporate Finance Institute driver-based planning guide lays out, and they are what let the model survive a change of hands.
Structure also decides whether a spreadsheet is still the right home. A well-built driver-based model in Excel is fine for many companies, but once several people need to update it, or the version-control emails start flying, dedicated software earns its cost. I weigh that tradeoff in forecasting software versus spreadsheets. The linked three-statement structure underneath, so that a driver change flows through P&L, balance sheet, and cash, is the backbone I describe in the linked three-statement model.

Wiring in Actuals
A model earns its keep only when actuals flow back into it every month, because a forecast you never compare to reality is a guess with good production values. Wiring in actuals means each month you drop in what really happened, place it next to what the model predicted, and read the variance driver by driver. That variance is the most valuable output the model produces, more valuable than the forecast itself.
The discipline is a monthly loop: update the drivers with the latest operational reality, load the actual financials, and ask a specific question at each line, "was the miss because the driver moved or because the relationship I assumed was wrong?" If units came in low, that is a driver update. If units were on target but revenue missed, your price or mix assumption is broken and needs fixing. This back-testing is how a model gets smarter over time instead of drifting. It is also how you catch a deteriorating assumption before it compounds into a bad decision. The gap between forecast and reality is exactly where the insight lives, and it is why more than 60% of organizations, per Layerz's 2026 productivity research, cannot forecast revenue within five percent: they never close the loop.
This actuals-versus-forecast loop is the practical core of a rolling forecast, where the horizon moves forward every month rather than resetting once a year. If that cadence is new to you, start with the rolling twelve-month forecast and why rolling forecasts suit companies past five million.

Using the Model to Decide
A model is only worth maintaining if it changes decisions, so the final test is whether you can ask it a real question and get an answer you will act on. Because a driver-based model is built on levers, you can flex a single assumption, such as raising price by three percent, slowing a hire, or cutting churn by a point, and watch the effect ripple through revenue, margin, and cash. That is the difference between a model that reports the past and one that steers the future.
Scenario work is where drivers pay off. Build a base case, a downside, and an upside by changing only the driver assumptions, and you have a decision tool rather than a single fragile prediction. Want to know whether you can afford two more salespeople? Change the headcount driver and read the cash impact across the next twelve months. This is the same scenario muscle I describe in sensitivity analysis and stress testing, now powered by levers you can actually pull. A word of caution on automating this too aggressively: even with better tools, judgment stays central, a point I make in the limits of AI forecasting.
This is where the model stops being a finance artifact and becomes an operating instrument. In the Greenwood Engagement Model, the driver-based model is the spine of the Operating Cadence stage: every month we update drivers, load actuals, read variance, and re-forecast, so the number in front of the founder is always current and always tied to a decision on the table. A model you update monthly is not overhead. It is the cheapest strategic advisor you will ever hire, because it tells you what your next move costs before you make it.
Frequently Asked Questions
What Is A Driver-Based Financial Model?
A driver-based financial model is a forecast that links financial outcomes to the operational levers that produce them, such as sales volume, price, headcount, churn, and utilization. Instead of typing revenue and cost directly into the model, you set the drivers and let the financials be calculated from them. When a driver changes, the whole model updates through its own logic, which is what makes it fast to maintain and useful for decisions.
How Do I Build A Model I Can Update Monthly?
Build it so a monthly update touches only assumptions, never formulas. Put every driver in one clearly labeled place, keep the calculation layer free of hardcoded numbers, and separate inputs, logic, and reporting so data flows one direction. Then set a fixed monthly cadence: refresh the drivers, load actuals, and read the variance. If updating requires rewriting formulas or only one person can do it, the structure needs fixing before the model can survive.
Why Do Financial Models Become Useless?
Models become useless when they are too complex, stuffed with hardcoded assumptions, poorly documented, and disconnected from current business drivers. Under those conditions they are painful to update, so they are not updated, and they drift away from reality until no one trusts the outputs. The fix is a simpler, driver-based structure with transparent assumptions that one person other than the author can maintain.
What Are The Key Drivers In A Financial Model?
Common drivers include sales volume, pricing, product mix, customer churn, headcount, and billable utilization, plus working-capital metrics such as days sales outstanding, days payable outstanding, and inventory days. The right set for your business is the small group of levers, usually five to nine, that explain most of the variance in your results. Any driver that would not change a decision if it moved should be left out to keep the model maintainable.
How Many Drivers Should A Model Have?
Fewer than you think, typically five to nine core drivers. The goal is to capture the levers that move most of your financial results while keeping the model simple enough to update in an afternoon. Adding more drivers increases complexity faster than accuracy, and past a point it makes the model fragile and unmaintainable. Start with the handful that carry your P&L and add another only when it clearly changes a decision.
References
- EY, 2026 FP&A Trends Research
- FP&A Trends Survey 2025 (OneStream)
- Vena Solutions, 7 FP&A Trends Shaping 2026
- Layerz, FP&A Productivity Statistics 2026
- Anders Liu-Lindberg on keeping models simple
- Jirav, What Is Driver-Based Modeling
- Corporate Finance Institute, Driver-Based Planning in FP&A
- Best Practices in Driver-Based Modeling (AFP)
