

Scenario Planning for Zero Job Growth: The 2026 Labor Shortage Financial Model
Published: 2026-05-08 • Estimated reading time: 9 min
For the past decade, my team and I have built financial models for hundreds of mid-market companies. They all shared a common, almost comforting, assumption: if you hit your revenue targets, you could always hire more people. Growth meant adding headcount. That assumption is now the most dangerous liability on your balance sheet.
We’re in 2026, and the math has irrevocably changed. The persistent labor shortage isn’t a cyclical blip; it’s a demographic wall. The old playbook of throwing bodies at problems is not just expensive; it’s impossible. Companies that continue to build their financial modeling around headcount growth are forecasting their own obsolescence. They are systematically underestimating margin compression and missing the single biggest strategic pivot of our time: shifting capital from an ever-more-expensive payroll to productivity-enhancing automation.
This isn’t about scaremongering. It’s about building a resilient financial model that reflects the new economic reality. The goal is no longer to grow your team. The goal is to grow your revenue per employee.
The Demographic Reality: Why Traditional Headcount Planning is Obsolete
Traditional headcount planning is obsolete because it’s built on the flawed premise of a consistently available labor supply, a condition that no longer exists. For generations, leaders could treat labor as a relatively elastic commodity. Need to scale output? Hire more people. That spigot has been turned off. We are now in an era of zero job growth potential, not because of a lack of jobs, but a lack of people to fill them.

My team sees the fallout in boardrooms every week. CEOs are baffled why their multi-million-dollar recruiting budgets are yielding fewer and worse candidates. The answer lies in simple, brutal demographic data. The U.S. labor force participation rate has struggled to recover to pre-pandemic levels and is projected to decline through 2034, according to analysis from Indeed Hiring Lab. An aging population, shifting immigration policies, and changing worker preferences have created a permanent structural deficit in the workforce.
As of the latest Bureau of Labor Statistics report, the number of job openings continues to stubbornly outpace the number of available workers. This isn't a temporary mismatch; it's the new equilibrium. Your five-year plan, with its neat 3-5% annual headcount increase, isn’t just optimistic—it’s a fantasy. Continuing to model your business this way is like planning a cross-country road trip using a map from 1985. The roads just aren’t there anymore.
Adjusting the Model: Factoring in Hyper-Wage Inflation and Retention Costs
To account for this new reality, your financial model must treat labor costs not as a predictable input but as a highly volatile variable subject to hyper-inflation. The old method of applying a blanket 3% annual merit increase across the board is a recipe for disaster. The real cost of labor is exploding, driven by a bidding war for scarce talent and the soaring cost of backfilling roles.
My team insists on baking three critical, dynamic variables into our clients' workforce planning models:
Segmented Wage Inflation: Instead of a single rate, we apply different inflation multipliers to different job families. A software engineer’s salary might inflate at 8% annually, while an administrative role might see 5%. This reflects the reality of the skills gap. Data from the ADP Research Institute shows that wage growth for job-switchers consistently outpaces that for job-stayers, creating intense market pressure.
Cost of Turnover: We model the fully-loaded cost to replace an employee, which we conservatively peg at 50-200% of their annual salary, depending on the role’s complexity. This includes recruiter fees, lost productivity during vacancy, training time for the new hire, and the institutional knowledge that walks out the door.
Retention Premium: This is a proactive line item. How much are you willing to invest ahead of the curve to keep your top performers from even looking? This isn't about spot bonuses; it's a strategic fund for things like surprise raises, enhanced benefits, or professional development that locks in your most valuable assets.
Here’s a look at how the thinking has to change:
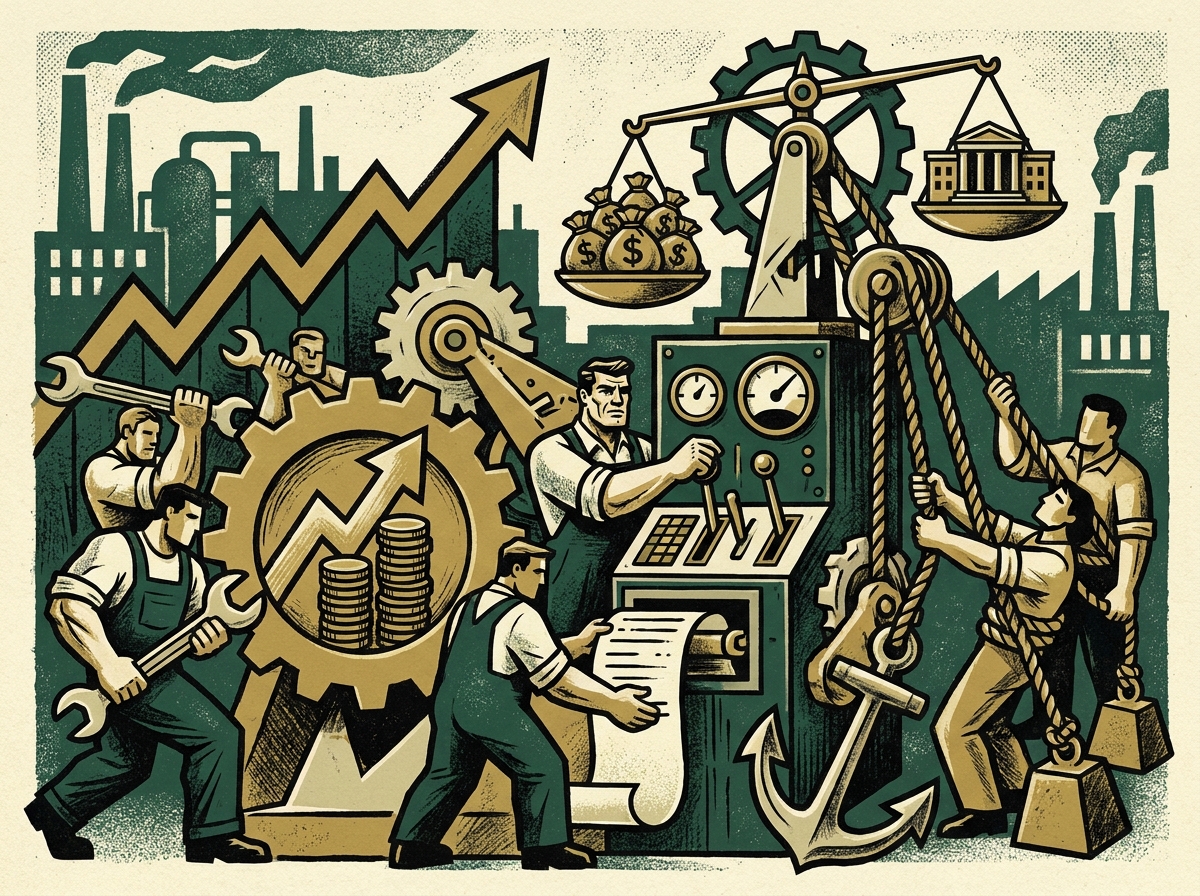
As one CFO of a $50M manufacturing company recently told me, “We used to budget for what we wanted to pay people. Now we budget for what the market demands we pay them. It’s a complete inversion of power, and our P&L is feeling it.”
The ROI of Automation: Trading Payroll for CapEx
The return on investment (ROI) for automation is calculated by treating it as a capital expense that directly offsets the volatile, ever-increasing operational expense of payroll. In this new labor environment, the classic CapEx vs. OpEx debate is being settled decisively. Investing in technology that multiplies the productivity of your existing team is no longer a luxury; it’s a survival mechanism. It’s the only way to decouple your company’s growth from headcount.
For years, automation was a “nice to have.” Now, my fractional CFOs and I model it as a strategic imperative. The math is compelling. A $250,000 investment in a software platform or robotic process automation (RPA) that eliminates the need for three full-time employees—who would cost you $80,000 each in fully-loaded salary per year—pays for itself in just over a year. But the real win is what happens in Year 2 and beyond. The software’s cost stays flat, while the payroll cost you avoided would have inflated by another 5-8%.

This is about identifying operational bottlenecks and process friction, then surgically applying technology. It could be:
AI-driven CRM: Automating lead scoring and follow-up to make your lean sales team more effective.
Warehouse Automation: Using robotics to handle picking and packing, reducing reliance on scarce manual labor, a trend Automation.com highlights as critical for 2026.
Generative AI Tools: Deploying solutions that handle first-drafts of reports, code, or marketing copy, freeing up your high-cost knowledge workers for higher-value strategic tasks.
This shift requires a change in financial thinking. You’re trading a variable, unpredictable payroll line item for a fixed, depreciable asset on your balance sheet. This improves margin stability and, frankly, makes your business a more attractive and scalable asset.
Measuring the New North Star: Revenue Per Employee
Revenue Per Employee (RPE) is the new North Star metric because it directly measures your company’s operational leverage and efficiency in a talent-constrained economy. For too long, CEOs have been obsessed with vanity metrics like headcount and office size. In a world of zero job growth, those metrics are meaningless. The only thing that matters is how much revenue you can generate with the talent you have.

RPE cuts through the noise. It tells you if your investments in technology, training, and process improvement are actually working. If your revenue is growing by 15% but your RPE is flat, you haven’t built a scalable business; you’ve just bought more payroll. According to benchmarks from SaaS Capital, top-quartile companies consistently post higher RPE figures, indicating superior capital efficiency.
Here’s how to embed RPE into your financial modeling and strategic planning:
Set RPE Targets: Don't just track it; make it a primary KPI. Your goal should be to increase RPE by a target percentage each year. This forces a conversation about productivity, not just hiring.
Model Headcount as a Constraint: In your forecast, cap headcount growth at a realistic, minimal level (say, 1-2%). Then, model how you will bridge the gap to your revenue goals through RPE improvement.
Link Bonuses to RPE: Tie executive and team compensation to RPE targets. This aligns the entire organization around a culture of efficiency and productivity. When everyone is focused on increasing output without increasing headcount, you unlock real innovation.
Sensitivity Analysis: Stress-Testing Your Margins Against Labor Scarcity
Sensitivity analysis is the process of stress-testing your financial model by changing key labor-related assumptions to see how they impact your profitability and cash flow. This isn't an academic exercise; it's a corporate war game for the new economy. It helps you identify your biggest vulnerabilities before they hit your P&L.
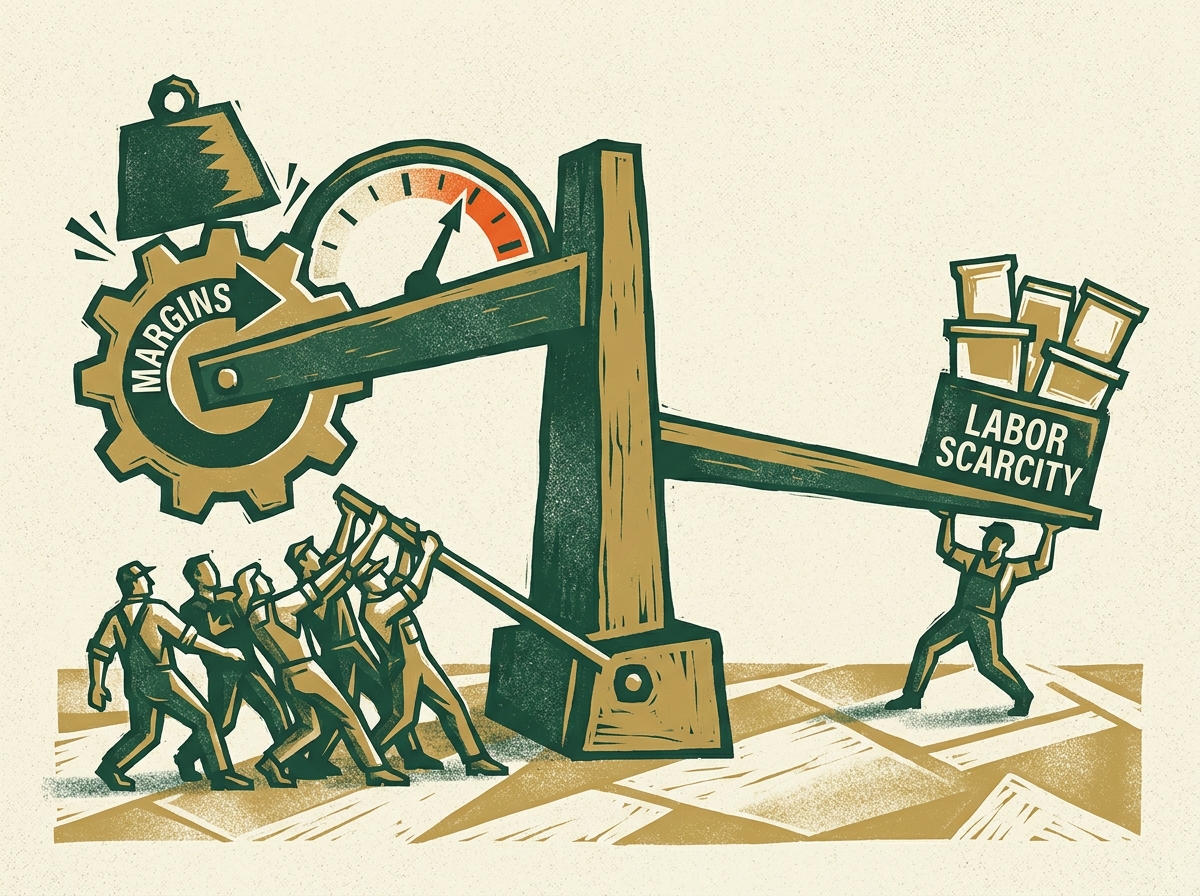
At Greenwood Business Consultants, we build a "Labor Scarcity Dashboard" for our clients' models. We isolate the most volatile assumptions and model best-case, base-case, and worst-case scenarios. I urge you to run these three stress tests immediately:
The Turnover Shock Test: What happens to your gross margin if your voluntary turnover rate for key roles suddenly jumps from 10% to 20%? Model the increased recruitment costs and the revenue drag from unfilled positions. How long can you sustain that before breaking even?
The Wage Inflation Test: What if the market rate for your most critical talent inflates by 15% next year, not the 7% you budgeted for? How much does that compress your EBITDA margin? At what point do you need to raise prices or make a major automation investment to compensate?
The Time-to-Fill Test: Your average time-to-fill an open role is currently 45 days. What if it stretches to 75 days due to increased competition? Model the direct impact on your production capacity or your ability to service new clients. This helps quantify the cost of operational bottlenecks caused by hiring friction, as detailed by Corporate Finance Institute.
By running these scenarios, you move from a reactive to a proactive stance. You stop hoping the labor market will get better and start building a business that can thrive even if it gets worse. This is the essence of strategic financial modeling in 2026: building a plan for the world as it is, not as we wish it were.
Frequently Asked Questions
How is the shrinking labor pool affecting corporate financial models in 2026?
The shrinking labor pool fundamentally breaks traditional financial models by invalidating the core assumption that headcount can scale with revenue. It forces a shift from payroll-centric to productivity-centric forecasting, where rising wage inflation, high turnover costs, and talent acquisition challenges become primary drivers of margin compression and must be modeled as key variables rather than stable inputs.
What variables must be adjusted in a financial model to account for wage inflation?
To accurately account for wage inflation, a financial model must replace a single, flat cost-of-living adjustment with dynamic, segmented variables. These should include different inflation rates for high-demand vs. standard roles, a fully-loaded 'cost of turnover' that captures recruitment and lost productivity expenses, and a proactive 'retention premium' budget to keep top talent from entering the competitive market.
How can mid-market companies maintain margins without adding headcount?
Mid-market companies can maintain and even improve margins without adding headcount by reallocating capital from payroll to strategic automation and technology investments. This involves focusing relentlessly on increasing Revenue Per Employee (RPE) as a primary KPI, using technology to eliminate operational bottlenecks, and empowering a leaner, more productive workforce to drive growth, effectively decoupling revenue from headcount.
References
