

Fractional CFO for Manufacturing: Mastering Supply Chain Finance
Published: 2026-04-03 • Estimated reading time: 9 min
I’ve sat across the table from dozens of manufacturing founders, and the conversation always circles back to the same brutal truth: the financial levers that work in software or services will break you in manufacturing. The game is different. It’s a physical world of inventory, raw materials, and complex production cycles where cash flow isn’t just king—it’s the oxygen supply. My work providing Fractional CFO services has revealed that the single greatest point of leverage for a manufacturing CEO isn’t on the sales floor; it’s buried deep within the supply chain.
Most leaders treat supply chain finance as reactive cost management. It’s a game of whack-a-mole with shipping fees and supplier price hikes. The reality? A proactive, systematic approach to your supply chain can unlock millions in working capital, hedge against crippling volatility, and create a durable competitive advantage. It’s about transforming your cost of goods sold (COGS) from a liability into a strategic weapon. Let's break down how my team and I guide companies through this transformation.
The Unique Pressures of Manufacturing Finance
Manufacturing finance is fundamentally about managing the flow of physical goods and the capital tied to them. Unlike a SaaS company with near-zero marginal costs, a manufacturer’s growth is directly handcuffed to its ability to fund more raw materials, more labor, and more inventory. This creates a unique cash conversion cycle where money is spent long before it’s earned, putting immense pressure on working capital. A recent KPMG report highlights that after years of shocks, supply chain resilience is now the top priority, with 71% of leaders actively redesigning their supply chains for greater stability.

This isn’t just an operational headache; it’s a strategic C-suite problem. Fluctuations in tariff policy, as analyzed by researchers at Yale University, can erase margins overnight. Geopolitical instability can sever access to critical minerals, as noted by J.P. Morgan, sending shockwaves through your production line. Your job as a leader is to build a financial framework that can absorb these hits. That’s the core of lean finance in a modern manufacturing environment.
Inventory: The Silent Cash Killer
Inventory is the single largest consumer of working capital for most manufacturers and the most misunderstood asset on the balance sheet. While accountants see it as an asset, I see it as cash set on fire. The true cost of holding inventory—your inventory carrying cost—is far more than just storage fees. It’s a pernicious blend of capital cost, storage, insurance, taxes, obsolescence, and shrinkage. For many businesses, this hidden cost can be as high as 25% to 30% of the inventory’s value annually, according to analysis by Fishbowl Inventory.
To master your finances, you must master inventory turnover optimization. The first step is calculating its true cost:
- Capital Costs: What’s the cost of the money (debt or equity) tied up in inventory that you can't use elsewhere? Start with your company’s interest rate or required rate of return.
- Storage Space Costs: This includes warehouse rent, utilities, climate control, and security—the total cost of the square footage your inventory occupies.
- Service Costs: Think insurance premiums to cover your inventory, the cost of the physical handling and labor, and the software you use to manage it.
- Inventory Risk Costs: This is the big one. It covers shrinkage (theft/damage), product obsolescence (especially in tech or seasonal goods), and spoilage.
Running this analysis doesn’t just give you a number; it gives you a mandate. It forces you to ask hard questions about your demand forecasting, production scheduling, and whether a just-in-time (JIT) manufacturing model, known to streamline efficiency as noted by Autodesk, could be adapted to your operations.
Hedging Against Raw Material Volatility
Raw material volatility is the variable that can unravel even the most precise financial model. A manufacturer is essentially a massive arbitrage machine, betting that they can convert raw inputs into finished goods at a profitable spread. But when input prices swing wildly, that bet gets terrifyingly risky. We saw this with motor prices pushed higher by supply chain issues, a trend Vybronics has been tracking, and it’s a pattern repeating across countless industries.
An experienced fractional CFO for manufacturing doesn't just track these costs—they build a strategy to mitigate the risk. This goes beyond simply finding the cheapest supplier. It involves a multi-pronged approach:
- Strategic Sourcing: Diversifying your supplier base across different geographies to reduce geopolitical risk. This might mean a slightly higher price from a domestic supplier is worth the stability it provides.
- Contract Negotiation: Building clauses into supplier contracts that offer some level of price protection, such as fixed-price agreements for a set term or price collars that limit the range of fluctuation.
- Financial Hedging: For larger companies exposed to major commodity markets (metals, oil, agricultural products), using financial instruments like futures or options to lock in prices and create budget certainty.
- Scenario Planning: Modeling the P&L impact of a 10%, 25%, and 50% increase in your top five raw material costs. What’s your break-even point? At what price does a product line become unprofitable? This isn't just a fire drill; it's essential for strategic decision-making.
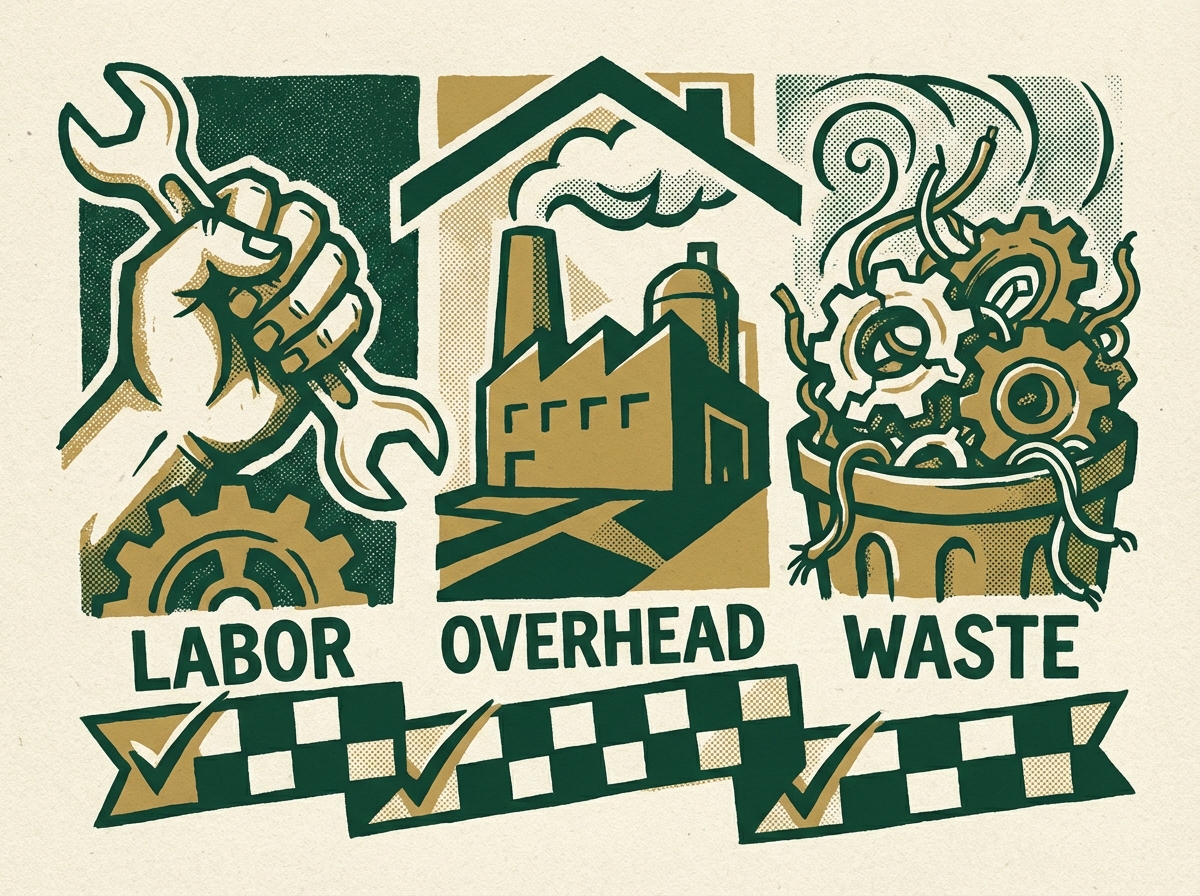
The 'True Cost' Checklist: Labor, Overhead, and Waste
Calculating your total manufacturing cost is the foundation of a sound financial strategy, yet it’s shocking how many companies get it wrong. They focus on direct materials and labor but use a blunt instrument—like a percentage of labor costs—for manufacturing overhead allocation. This practice hides inefficiencies and leads to poor pricing and product-mix decisions. According to a BCG analysis, a granular focus on COGS is a primary driver of value creation.
Here is my team's checklist for a more accurate total manufacturing cost calculation:
- [✓] Direct Material Costs: The cost of all raw materials and components that become part of the final product. This must include freight-in and tariffs.
- [✓] Direct Labor Costs: Wages and benefits for the employees directly involved in hands-on production.
- [✓] Manufacturing Overhead Costs: This is the most complex bucket. You must capture all indirect costs associated with production. This includes:
- Indirect Labor (supervisors, quality control, maintenance staff)
- Factory Rent/Depreciation
- Equipment Depreciation & Maintenance
- Utilities for the Production Facility
- Production-related Software & Licensing
- [✓] Waste & Spoilage Calculation: Quantify the cost of materials and labor for goods that don’t pass quality control. Global waste generation continues to be a massive hidden cost, as tracked by the Global Waste Index.
To truly understand profitability, you must allocate overhead correctly. Here’s a quick comparison:
| Allocation Method | How It Works | Best For | Downside |
|---|---|---|---|
| Traditional Costing | Applies overhead based on a single driver, like direct labor hours or machine hours. | Simple operations with a uniform product mix. | Distorts costs for diverse product lines; can make simple products seem too costly and complex ones too cheap. |
| Activity-Based Costing (ABC) | Links overhead costs to specific activities (e.g., machine setups, quality inspections) and then assigns them to products based on their consumption of those activities. | Complex operations with multiple products and processes. | More complex and time-consuming to implement and maintain. |
For a growing manufacturer, moving toward an ABC model is often a game-changer, providing a much clearer picture of per-unit profitability.
Implementing Real-Time Production Analytics
Real-time production analytics are the nervous system of modern manufacturing finance. Relying on month-end reports to make operational decisions is like driving by looking in the rearview mirror. To optimize production efficiency and control costs, you need live data from the factory floor translated into financial metrics. Aktion Associates notes that 63% of manufacturers are now investing in smart technology to improve data collection and analysis.
As part of our Fractional CFO services, we help leadership teams build and monitor a dashboard of key manufacturing KPIs that connect operations to financial outcomes. These often include:
- Overall Equipment Effectiveness (OEE): A master metric that combines availability, performance, and quality to measure manufacturing productivity.
- Capacity Utilization: Are you getting the most out of your expensive machinery and facilities? This metric tells you.
- Unit Production Cost: Tracks the total cost to produce one unit in near real-time, flagging deviations immediately.
- Cash Conversion Cycle: Measures the time it takes to convert resource inputs into cash flows. For manufacturers, shortening this cycle is paramount.
This data-driven approach allows you to spot a machine that needs maintenance before it fails, identify a production line that’s running slow, or see a spike in waste from a bad batch of materials—all before they become catastrophic financial problems. This is where lean finance and operational excellence converge.
Frequently Asked Questions
What are the key financial challenges for manufacturing companies in 2026?
The primary challenges are managing intense working capital pressure from inventory and supply chain disruptions, hedging against raw material price volatility driven by geopolitical factors, navigating complex tariff and trade policies, and funding the significant capital expenditures required for technology and automation to combat labor shortages and improve production efficiency.
How do you calculate the true cost of inventory holding?
The true cost of inventory holding, or carrying cost, is calculated by summing four key components: capital costs (the cost of money tied up in inventory), storage costs (rent, utilities, security), service costs (insurance, taxes, handling labor), and inventory risk costs (obsolescence, shrinkage, spoilage). This total is then expressed as a percentage of the inventory's value.
How can a Fractional CFO improve supply chain resilience?
A Fractional CFO improves resilience by moving beyond simple cost tracking to implement a strategic financial framework. This includes developing diversified sourcing strategies to mitigate geographic risk, negotiating supplier contracts with price stability clauses, implementing financial hedging for key commodities, and using scenario planning to model the P&L impact of potential disruptions, ensuring the company has a financial plan to weather supply chain shocks.
References
- https://kpmg.com/us/en/articles/2026/supply-chain-trends-2026.html
- https://budgetlab.yale.edu/research/tracking-economic-effects-tariffs
- https://www.jpmorgan.com/insights/global-research/commodities/critical-minerals
- https://www.fishbowlinventory.com/blog/what-is-carrying-cost
- https://www.autodesk.com/blogs/design-and-manufacturing/benefits-of-jit-manufacturing-streamlining-efficiency-and-quality/
- https://www.vybronics.com/blog-post/2025-2026-raw-material-supply-chain-issues-push-motor-prices-higher
- https://www.bcg.com/publications/2024/why-manufacturers-should-focus-on-cost-of-goods-sold
- https://www.sensoneo.com/global-waste-index/2025/
- https://www.aktion.com/how-manufacturers-are-improving-efficiency-in-2026/
