

E-Commerce Unit Economics in 2026: Mastering the Cash Conversion Cycle
Published: 2026-05-02 • Estimated reading time: 8 min
The venture capital darlings of the last decade are now the cautionary tales of this one. For years, my team and I have sat in boardrooms watching founders chase revenue at any cost, fueled by cheap capital and the siren song of Facebook ads that, for a time, printed money. That era is definitively over. In 2026, the game isn’t about growth; it’s about survival, and survival is a mathematical equation. The single most important variable in that equation is your Cash Conversion Cycle. Mastering your unit economics has shifted from a “nice to have” financial exercise to the literal lifeblood of your operation.
We’re in a new world where profitability is no longer a distant milestone but a weekly, if not daily, obsession. The technical skill that separates the founders who will thrive from those who will be acquired for parts is the ability to model, measure, and ruthlessly improve the time it takes to turn inventory back into cash. This isn’t just about margins; it’s about capital velocity.
The Death of Cheap Acquisition: Recalculating the True CAC
The true Customer Acquisition Cost (CAC) is the fully-loaded expense required to acquire a net-new, profitable customer, factoring in all creative, personnel, and platform costs against the backdrop of waning attribution data. For years, founders got away with a dangerously simplistic formula: Ad Spend / New Customers = CAC. It was a convenient fiction. The real cost was always higher, obscured by venture subsidies and a firehose of cheap traffic. That firehose has been reduced to a trickle, and the water is expensive.
My team sees it constantly: brands that were built on a sub-$50 CAC are now staring down acquisition costs north of $120 for the same customer profile. Why? The perfect storm of data privacy changes, channel saturation, and a more discerning, economically-pressured consumer. According to a recent Business of Apps analysis, user acquisition costs have climbed over 60% across the board since the pre-pandemic boom. The old playbook of blitzscaling on paid social is not just inefficient; it’s a direct path to insolvency. The focus must shift from acquiring any customer to acquiring the right customer, whose lifetime value can justify today’s astronomical costs. This means building actual brand equity, not just renting eyeballs.
Dissecting the Cash Conversion Cycle for Product-Based Businesses
The Cash Conversion Cycle (CCC) is the number of days it takes for a company to convert its investments in inventory and other resources back into cash from sales. It’s the ultimate measure of your capital efficiency. For a direct-to-consumer brand, it’s everything. It tells you how long your cash is tied up in things you can’t use to pay salaries, run ads, or develop new products. A shorter cycle means you have a self-funding growth engine; a long cycle means you’re perpetually on the brink of a cash crunch, constantly seeking dilutive funding or expensive debt just to keep the lights on.
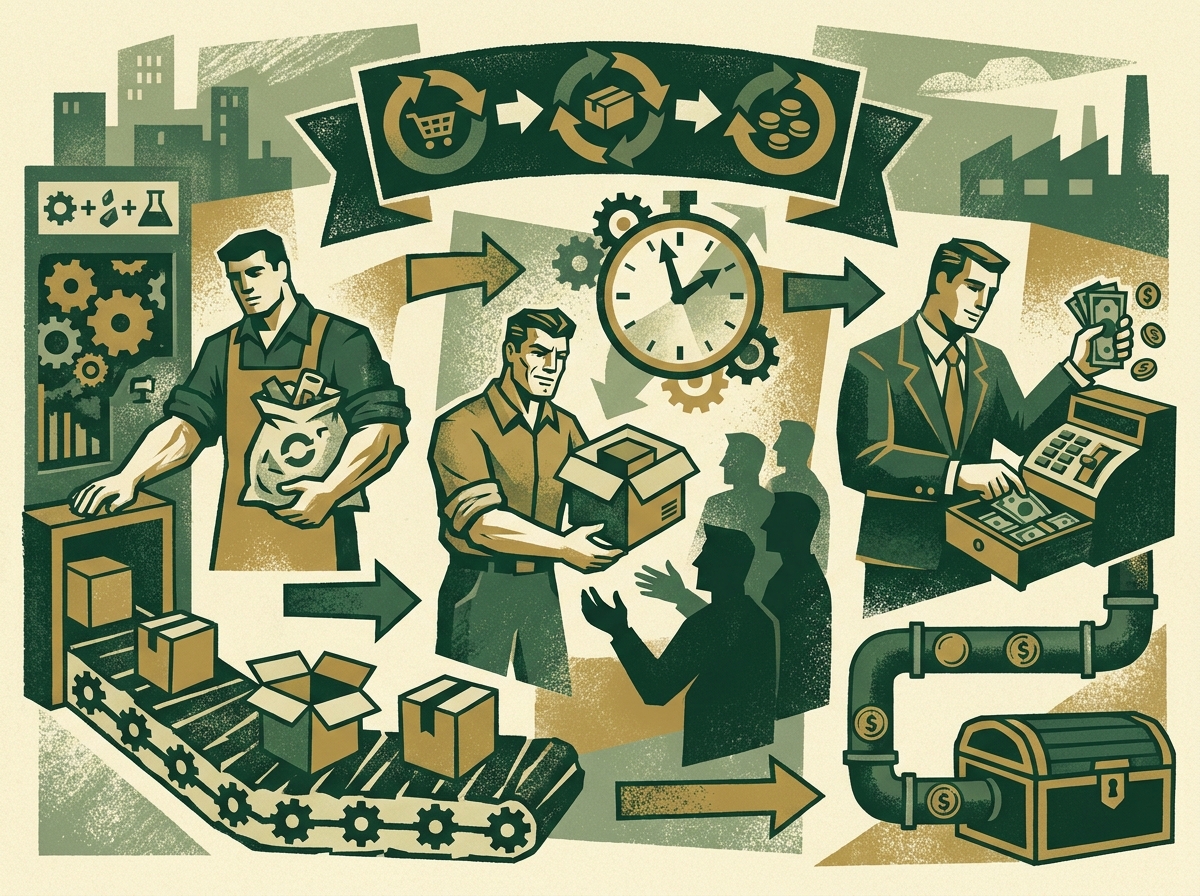
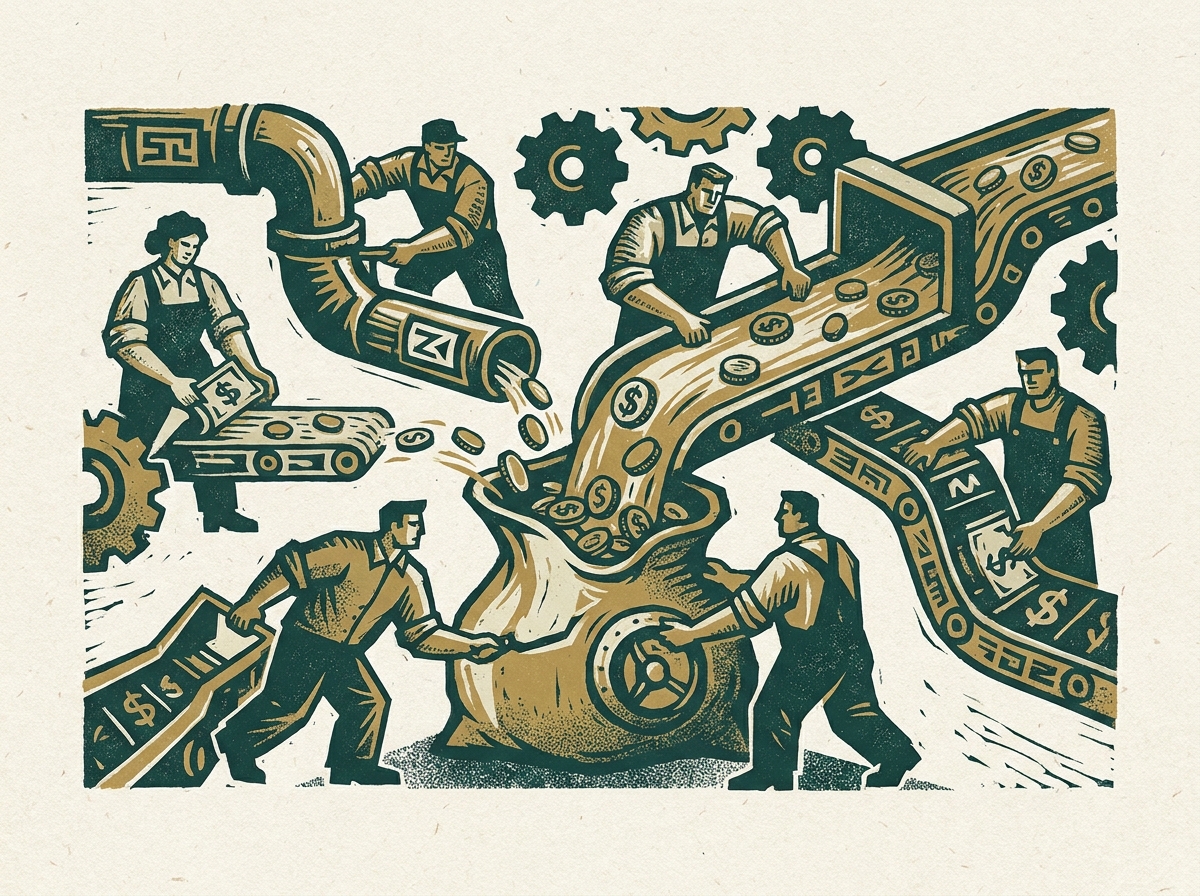
Think of it like this: your business is a pump. Cash flows in from customers, then gets pumped into inventory and operations, and then (hopefully) flows back out as cash from new sales. The CCC is the time it takes for one drop of water to make that full circuit. If the circuit is too long, the pump runs dry.
The formula is brutally simple:
CCC = Days of Inventory Outstanding (DIO) + Days Sales Outstanding (DSO) - Days Payable Outstanding (DPO)
Your job as a founder is to attack each of these components with the ferocity of a starved wolf. Squeeze your DIO, crush your DSO (for most DTC, this is near zero, a rare gift), and strategically extend your DPO without torching your supplier relationships.
Inventory Strategy: Balancing Stockouts vs. Dead Capital
An effective inventory strategy is the art of holding the absolute minimum amount of product required to meet customer demand without risking costly stockouts. Inventory is not an asset on a balance sheet; it’s cash that you’ve frozen in a warehouse. Every day it sits there, it accrues carrying costs—storage, insurance, obsolescence—that eat directly into your gross margin. BlueCart estimates these carrying costs can be as high as 25-30% of your inventory's value annually.
Rethinking Inventory Valuation
Inventory valuation is the accounting method used to assign value to unsold inventory, directly impacting your Cost of Goods Sold (COGS) and, therefore, your profitability on paper. Methods like FIFO or LIFO aren’t just for your accountant; they are strategic decisions. In an inflationary environment, your choice of valuation method can dramatically alter your reported gross margin, which in turn affects everything from your ability to secure financing to your own internal perception of product-line profitability. You need to understand precisely how your COGS are calculated and model how geopolitical events, like the tariff impacts we’re seeing in 2026, flow through to your unit economics.
The New Rules of Demand Forecasting
Modern demand forecasting is a sophisticated, data-driven process that uses historical sales data, market trends, and predictive analytics to estimate future customer demand. The era of gut-feel forecasting based on last year’s sales is over. Persistent supply chain disruptions have made six-month lead times the new normal for many components. A miscalculation doesn’t just mean a stockout; it means a six-month stockout. It means you’ve paid to acquire a customer who came to your site ready to buy, only to send them to a competitor. The cost of that failure is catastrophic and goes far beyond the lost sale.
Channel Profitability: Knowing Where You Actually Make Money
Channel profitability is the granular analysis of your contribution margin on a per-channel basis, after accounting for all channel-specific costs like marketplace fees, unique fulfillment requirements, and targeted ad spend. The founders who still talk about their “blended” margin are the ones my team is usually meeting for the first time during a restructuring. Blended metrics are for amateurs. You don’t have a business; you have a portfolio of channels, and each one is its own P&L.
Selling on Amazon is not the same as selling on your Shopify store, which is not the same as a wholesale partnership with a national retailer. The unit economics are wildly different. You might have a 45% gross margin on your DTC site but a razor-thin 8% on a marketplace after all fees are paid. Without this clarity, you risk pouring marketing dollars into channels that are actively losing you money on every single order.
Here’s a simplified look at how the math can break down:
Note: This is a simplified model. The numbers can swing wildly, but the principle is what matters. Amazon's CAC might seem lower, but the fees are a killer. Wholesale has a lower gross profit but can have a fantastic, low-CAC contribution margin.
This is the work. This is the math that determines whether you have a viable business or a very expensive hobby.
Building a Resilient Direct-to-Consumer Financial Model
A resilient financial model is one where the fundamental unit economics are so sound that the business generates enough cash from its core operations to fund its own growth. It’s a model built not on hope, but on a deep, mathematical understanding of the interplay between acquisition, conversion, and retention. It’s about building a business that gets stronger, not just bigger, with every sale.
This means obsessing over Gross Margin Return on Investment (GMROI), which tells you how much gross profit you earn for every dollar invested in inventory. A report from OpenSend highlights that top-quartile retailers aim for a GMROI above 3.2, meaning they generate $3.20 in margin for every $1 of inventory cost. It means A/B testing pricing to understand your pricing elasticity and finding the sweet spot that maximizes revenue without killing conversion. It means investing heavily in retention and owned channels like email and SMS, where the cost of a repeat purchase is a fraction of acquiring a new customer.
Ultimately, the founders who succeed in this new era will be the ones who respect the unforgiving math of cash flow. They will treat their balance sheet with the same reverence as their brand. They won’t just be merchants or marketers; they will be capital allocators. And in 2026, that is the only job that matters.
Frequently Asked Questions
How are supply chain issues affecting e-commerce unit economics?
Supply chain issues directly degrade e-commerce unit economics by increasing both landed Cost of Goods Sold (COGS) and inventory carrying costs. Geopolitical tensions and logistical bottlenecks have driven up freight and material costs, squeezing gross margins. Furthermore, longer and less predictable lead times force brands to hold more safety stock, which inflates carrying costs and ties up working capital that could be used for growth, negatively impacting the Cash Conversion Cycle.
What is the cash conversion cycle and why is it critical for DTC brands?
The Cash Conversion Cycle (CCC) is a key metric that measures the number of days it takes for a direct-to-consumer brand to convert its investment in inventory into cash from sales. It is absolutely critical because it represents the time a company's cash is tied up in the operating cycle. A long CCC can create severe cash flow problems, even for a profitable company, forcing it to rely on debt or equity financing to fund operations. A short, or even negative, CCC is the hallmark of a highly efficient, self-funding business.
How can e-commerce companies optimize their inventory to improve cash flow?
E-commerce companies can optimize inventory to improve cash flow by focusing on increasing inventory turnover and implementing sophisticated demand forecasting. Key strategies include using data analytics to identify and liquidate slow-moving or dead stock (even at a loss) to free up capital, negotiating better payment terms with suppliers (extending Days Payable Outstanding), and implementing a just-in-time or lean inventory system where possible. The goal is to minimize the amount of cash sitting idle in a warehouse, thereby shortening the Days of Inventory Outstanding (DIO) component of the cash conversion cycle.
