

The AI Overwhelm Tax: Why More Finance Tools Made Your Numbers Worse
- The average company now runs well over 100 SaaS applications, and finance has quietly become one of the most bloated stacks in the building. The cost is not the subscription line. It is the reconciliation tax you pay every close.
- Better Financial Modeling does not come from owning more tools. It comes from owning fewer systems that agree with each other, so your team spends time on decisions instead of tie-outs.
- Judge every finance tool by one question: which decision does this make faster or better? Features you never use are not neutral. They are drag.
- A lean stack for a $5M+ company means one system of record for actuals, one integrated planning layer, and spreadsheets used as a presentation surface, never as the truth.
- Consolidation is not austerity. Firms that rationalized their stacks cut renewal spend by double digits and shortened close cycles at the same time.

The Hidden Cost of Every New Tool
I met a founder last year who was proud of his finance stack. He had a tool for billing, a tool for expenses, a tool for spend management, a separate tool for forecasting, a data warehouse someone in RevOps had stood up, and three Google Sheets that nobody was allowed to touch after 5 p.m. because that was when "the real numbers" got locked. He asked me to help him pick a seventh tool. I asked him how long his monthly close took. Eleven days. There was the answer, and it was not a software problem.
Here is the uncomfortable arithmetic. As of 2023, the average organization ran roughly 130 SaaS applications, up from about a dozen in 2016 and eight in 2010 (Zippia). Zylo's 2026 index puts the average at 305 applications and $55.7M in annual SaaS spend for the companies it tracks, with a median of 211 renewals to manage every year. Globally, companies waste an estimated $18 billion on unused subscriptions (Colorlib). The shelfware is real, and finance is often the department buying it, one point solution at a time, each one promising clarity and each one quietly adding a reconciliation.
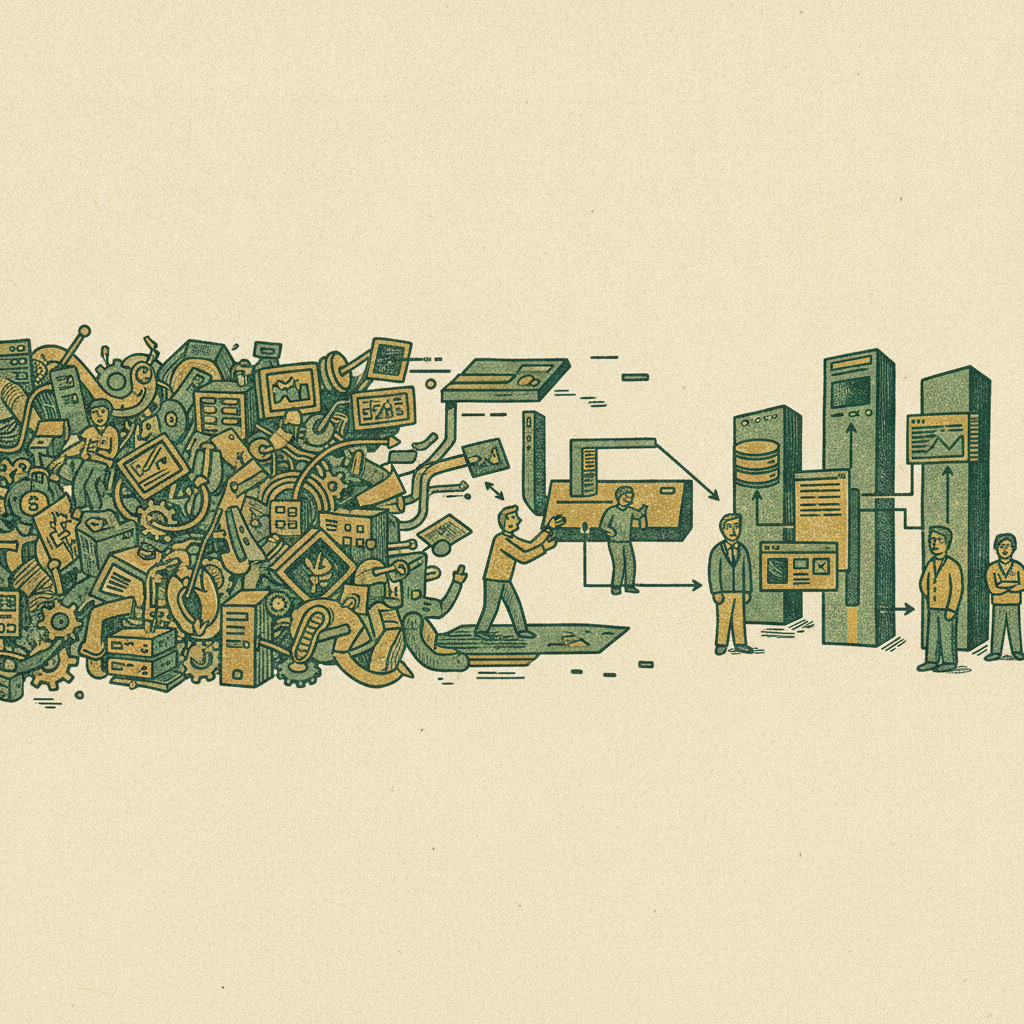
The subscription is the cheap part. The expensive part is what fragmentation does to your time. Ventana Research's long-running work on the office of finance has found that finance teams can spend as much as 75% of their time on data collection, validation, and reconciliation rather than analysis, largely because the systems do not talk to each other. Spreadsheet-driven environments take longer to close, with many organizations still needing 10 or more business days, and they carry more version-control errors that force rework and erode executive confidence in the numbers. That is the AI overwhelm tax. You bought eleven tools to see more clearly and ended up seeing later, and less certainly, than when you had three.
Decisions Enabled, Not Features Owned
The mistake is evaluating finance software the way you would evaluate a phone, by counting features. A better model, and the one I use with clients, is to evaluate every tool by the decisions it enables. Software does not have intrinsic value. It has value only when it shortens the distance between a number and a decision a leader has to make: how to price, when to hire, how much runway is left, where to put the next dollar of capital.
So for any tool, current or proposed, I ask four questions. Which specific decisions does this system materially improve? How much does it shorten the time from raw data to that decision? Does it reduce reconciliation work between systems, or does it add another silo that someone now has to tie out? And can leaders outside finance actually consume the output, or is it just more data pointed at people who already have too much?
This reframes the whole purchasing conversation. A category-leading tool that nobody outside finance can read, and that requires a nightly manual export to reconcile against the general ledger, is not an asset. It is a liability with a login. Analysts have been saying a version of this for years. Gartner has repeatedly warned that fragmented finance application landscapes increase the cost and risk of the close and impede real-time insight, and Ventana's Mark Smith has argued that the obsession with best-of-breed finance tools has created more silos than insights. The ROI is in integration and data quality, not in stacking one more niche tool on top of a broken core. If you want to see what disciplined modeling looks like once the plumbing is clean, my colleague's piece on the three-statement model your board actually reads is a good starting point.

Building a Single Source of Truth
Every functional finance stack has one thing in common. There is exactly one place the actuals live, and everyone knows where it is. This is the single source of truth, and it is less a product than a discipline.
In practice it means one system, or a tightly integrated set, owns the general ledger, AP, AR, and core reporting. Spreadsheets are allowed, but only as a presentation layer sitting on top of that system, never as the system of record itself. Above the ledger sits an integrated planning and analytics layer, an FP&A tool that connects natively to your ERP, CRM, HRIS, and bank feeds so that building a forecast does not require a human exporting CSVs at midnight. And crucially, you define clear boundaries: the ERP owns transactional integrity, the FP&A tool owns planning and scenarios, and business intelligence owns cross-functional analytics. When two tools both claim to produce "the official revenue number," you do not have redundancy. You have an argument that recurs every month.
The reason this matters is not tidiness. It is that a single source of truth is what lets you do useful modeling at all. You cannot run a credible scenario or a rolling forecast on top of three systems that disagree about last month. Get the source of truth right and Financial Modeling stops being an act of archaeology and starts being an act of decision support.
When to Consolidate Vendors
Consolidation has a bad reputation because it sounds like a cost-cutting exercise imposed by someone who does not understand what your tools do. Done well, it is the opposite. It is how you buy back time and accuracy. The trick is knowing when the stack has tipped from useful to bloated.
Here are the signals I watch for. You have more than two or three systems each holding an "official" number for revenue, cash, or headcount, and reconciliation debates have become a monthly ritual. Your close consistently runs past 10 business days because of system hops and manual tie-outs. Multiple tools are each used at less than 20% to 30% of their feature set, with overlapping reports between the ERP, the FP&A tool, and various point solutions. And your SaaS renewals are rising faster than revenue with no matching improvement in forecast accuracy or decision speed. When several of those are true at once, you are not underinvested in tooling. You are overinvested in fragmentation.
The evidence that consolidation pays is not subtle. Vena reports that 53% of organizations consolidated redundant SaaS apps in 2024, up sharply from the year before. BetterCloud found mid-sized firms cut their application counts by roughly 29% in 2025 once they ran active rationalization programs. Zylo's customers achieved an average of 17% savings at renewal by identifying redundant apps and right-sizing licenses. That is real money, but the bigger prize is the close cycle you shorten and the reconciliation hours you delete. The approach is straightforward: map every tool touching revenue, expenses, cash, and headcount, trace the data flows and manual tie-outs, and consolidate first where data is most fragmented and manual work is highest.

A Lean Stack for a Growth-Stage Company
So what should a $5M+ company actually run? Fewer things than it thinks, chosen deliberately. A single system of record for actuals covering the GL, AP, and AR. One integrated FP&A and planning layer wired directly into that system so scenarios and board packs build themselves rather than getting assembled by hand. One primary tool per function, one for billing, one for expense management, one for planning, with a second tool in any category only when there is a written, ROI-backed reason. And spreadsheets kept firmly in their place as a flexible presentation surface, not the vault.
The governance is as important as the architecture. Require that every finance tool be used by a defined set of roles against real usage KPIs, and put any tool that misses those thresholds for two or three quarters on a rationalization list. Before you buy anything new, demand a single page: which decision this improves, how soon, how you will measure it, and exactly how it integrates with the source of truth. If a founder or CFO cannot articulate the decision impact and the integration path in one page, the purchase is almost certainly tech-stack bloat wearing the costume of progress.
The best finance stack I have ever run was not the most sophisticated. It was the one where every number reconciled by default and my team argued about strategy instead of about which spreadsheet was current. That is the whole game. Tools are not the point. Decisions are. And if you want a clear-eyed view of where software genuinely helps versus where a human still has to own the judgment, I wrote about exactly that tradeoff in AI agents versus the fractional CFO.
Frequently Asked Questions
Why do more finance tools create more problems?
Because each new tool that does not integrate with your system of record adds a reconciliation step, a place for the numbers to disagree, and another login to manage. Ventana Research finds finance teams can lose up to 75% of their time to data collection and reconciliation. Past a certain point, adding tools slows you down and lowers confidence in the numbers rather than raising it.
How do you choose finance software that actually helps?
Judge it by decisions enabled, not features owned. For any tool, ask which specific decision it makes faster or better, how much it shortens the path from data to that decision, whether it reduces or adds reconciliation work, and whether non-finance leaders can actually use the output. If you cannot answer those in one page, do not buy it.
What should a lean finance stack include?
One system of record for actuals (GL, AP, AR), one integrated FP&A and planning layer connected natively to that system, one primary tool per function, and spreadsheets used only as a presentation layer. Add a second tool in any category only with a written, ROI-backed justification and a clear integration plan.
References
- Zippia, SaaS Industry Statistics: https://www.zippia.com/advice/saas-industry-statistics/
- Zylo, 175+ SaaS Statistics for 2026: https://zylo.com/blog/saas-statistics/
- Colorlib, SaaS Statistics 2026: https://colorlib.com/wp/saas-statistics/
- Vena Solutions, SaaS Statistics, Trends and Benchmarks 2026: https://www.venasolutions.com/blog/saas-statistics
- BetterCloud, The Big List of 2026 SaaS Statistics: https://www.bettercloud.com/monitor/saas-statistics/
- Ventana Research, Office of Finance and Financial Close benchmark research: https://www.ventanaresearch.com
